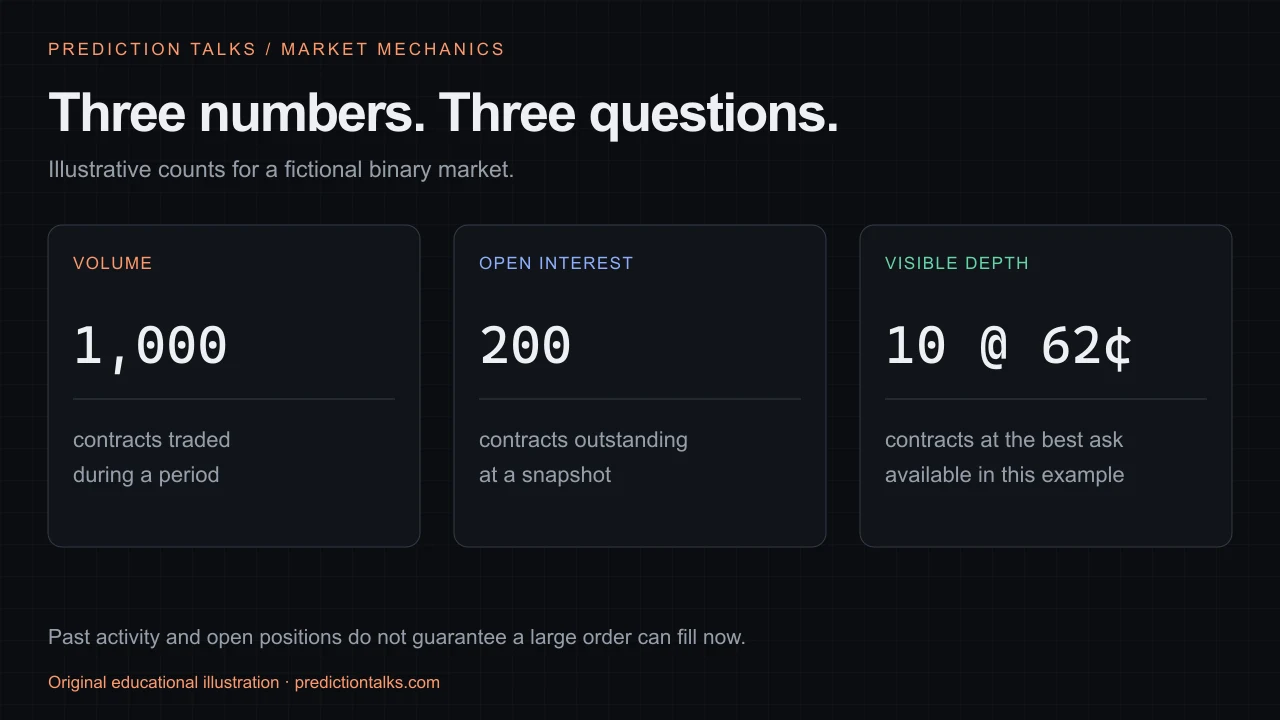
Liquidity, volume and open interest answer different questions. Volume describes completed trading during a period. Open interest describes outstanding contracts at an observation time. Liquidity concerns the prices and quantities available for a particular trade. A busy-looking market can still have little depth on the side you need.
This guide concerns binary event contracts. Perpetual futures, a site's dollar-denominated dashboard and a count of individual trades can use different measures. Begin with the field's definition, unit, time window and market identifier.
What prediction market volume tells you
Kalshi's prediction-market glossary defines volume in contracts traded during a period. Its current market API includes separate volume_fp and volume_24h_fp fields. A 24-hour figure should not be compared with a lifetime total as though they describe the same window.
Activity can involve positions changing hands more than once. Volume is therefore not a count of unique traders, their profit or the amount available for your next order. The time distribution also matters: a large total from an earlier burst does not establish that counterparties are present now.
Suppose a fictional market records 1,000 contracts traded during a day. That tells us about completed activity in the stated period. It does not reveal whether someone currently offers 1,000 contracts at the best ask, or whether those trades came from many independent participants.
What open interest tells you
Open interest tracks contracts that remain outstanding. It is a snapshot of a stock, while volume is activity measured across a period. One outstanding position can appear in several successive daily snapshots; summing those snapshots would count it repeatedly.
An existing position can change hands without creating an entirely new outstanding contract. That is one reason activity and open interest need not move together. Neither measure, by itself, establishes how much any named trader has earned.
Counting conventions matter. Kalshi's published notice, effective December 24, 2021, changed its volume and open-interest reporting to count a Yes/No pair as one contract. Check the current provider's definition before comparing a venue, historical export or aggregator. Do not silently double a number because a binary market has two outcome labels.
What liquidity and depth tell you
For a proposed purchase, inspect compatible offers to sell. For a proposed sale, inspect buying interest. Note the best price, available size across relevant levels and the price boundary you would allow. A narrow spread with only a tiny quantity at the top can be insufficient for a larger order.
Our fictional market can have 1,000 contracts traded that day and 200 outstanding, yet only ten offered at 62 cents right now. Those figures can coexist. They describe different dimensions, not three competing estimates of the same quantity.
Use the order-book guide to read bid/ask representations, then try the depth simulator. In its example, a 30-contract purchase uses multiple price levels. Assuming the entire quantity receives the best ask understates the cost.
Visible orders can change or disappear. Depth is an observation, not a promise of execution after a delay. Historical volume cannot repair that timing gap. The paper-trading guide explains why a simulation needs explicit fill assumptions.
Do not compare a contract count with unexplained dollars
A dashboard may report contracts, traded notional, cash consideration or a product-specific liquidity measure. A dollar sign does not tell you which one. Check whether the measure uses settlement face value, actual trade prices or another calculation, and whether it aggregates an entire event or one selected market.
For a simple hypothetical purchase of 100 contracts at 62 cents, the purchase consideration is $62 before fees. A $1 settlement face value across those 100 contracts is $100. Those are two different calculations, even before considering a provider's volume methodology.
For cross-platform research, preserve both the original value and its documented unit. Record the time window, observation timestamp and whether related markets were combined. Missing documentation is a reason to leave the comparison unresolved, not to choose the larger-looking number.
A useful market-reading checklist
Before interpreting an activity badge, answer four questions:
- Which contract and side? Event-wide totals may cover more than the selected outcome.
- What unit and period? Keep contracts, currency values and trade counts separate; distinguish rolling and lifetime windows.
- What could match now? Inspect spread and depth for the proposed size, with a timestamp.
- What remains uncertain? Current book changes, fees and the exact settlement condition are separate from past activity.
If an order has already been submitted, move to the order-status checklist. After an actual fill, compare costs and possible proceeds using the payout calculator. None of these market totals is a substitute for a trader's verified account ledger or evidence that a forecast is correct.