An 80% forecast can be wrong without being a nonsensical forecast. A trader can also earn money from a poorly assessed probability, or lose money while making a useful forecast. To evaluate prediction-market research, keep three questions separate: how good were the probabilities, how well calibrated were they, and what did the trades earn after costs?
The Brier score helps with the first question. It averages the squared gap between a probability and a resolved binary outcome. It is not a complete answer to the other two. Use our Brier score calculator to inspect the arithmetic, then apply the sampling checks below before drawing a conclusion.
Calculate a binary Brier score
Write the probability of Yes as a number from 0 to 1. An 80% forecast is 0.8. Code a Yes outcome as 1 and a No outcome as 0. For each forecast, calculate (p - outcome)^2, then take the equal-weight mean across the resolved observations.
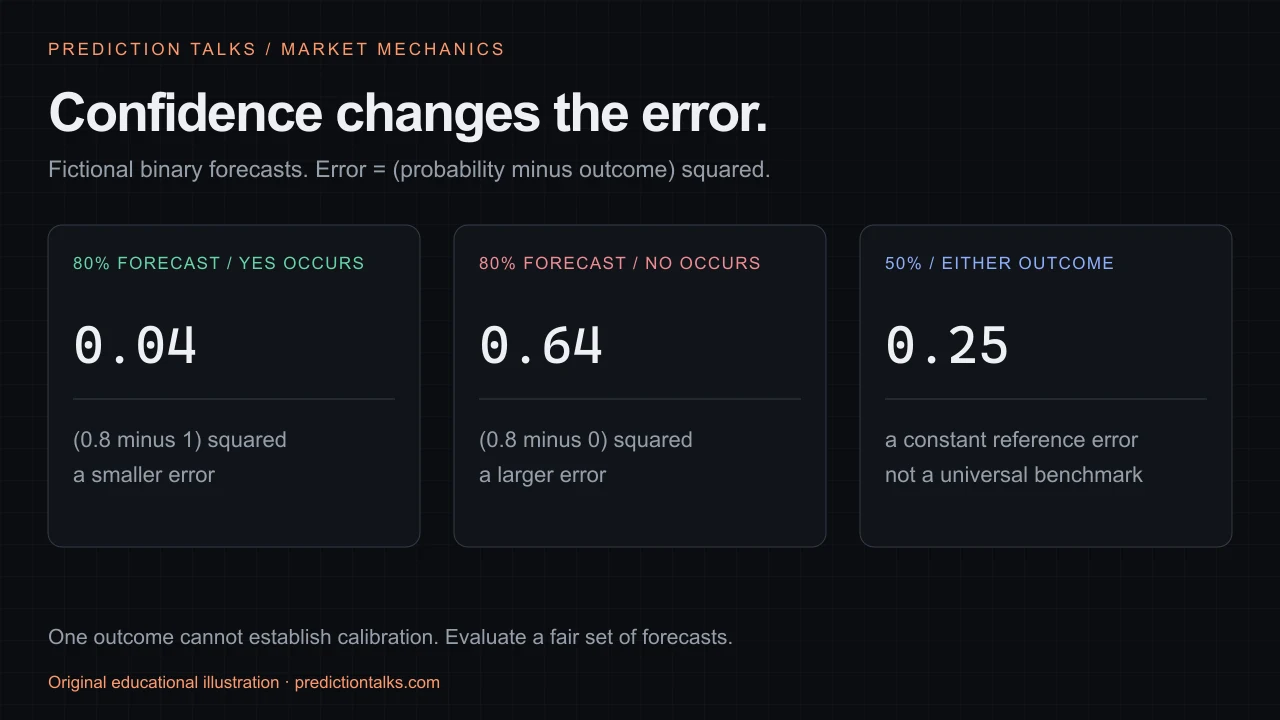
Here are three fictional examples:
- An 80% forecast followed by Yes has error
(0.8 - 1)^2 = 0.04. - The same 80% forecast followed by No has error
(0.8 - 0)^2 = 0.64. - A 50% forecast has error 0.25 for either resolved binary outcome.
For four fictional events with errors 0.04, 0.64, 0.64 and 0.04, the mean is 1.36 / 4 = 0.34. This guide and calculator use the binary 0–1 convention: zero is the smallest possible error, and one is the largest. Some implementations sum the Yes and No category errors and use a 0–2 scale. Check the convention before comparing published scores; 0.34 on one scale is not directly comparable to 0.34 on the other.
The scoringrules methodology explains the binary squared-error definition and its relationship to categorical scoring. The scikit-learn metric reference documents the scale distinction explicitly. Our tool implements the arithmetic directly; it does not send data to either service.
Use the calculator without changing the units
The input header is probability_percent,outcome. Enter 70 for 70%, rather than 0.7. In these percent columns, 0.7 means 0.7%, which the tool converts to 0.007. Accepted outcomes are yes, no, 1, 0 and unresolved.
probability_percent,outcome
80,yes
80,no
20,yes
20,no
70,unresolved
The four resolved rows score 0.3400. The fifth row is reported as unresolved and excluded. A missing or unrecognized outcome is an input error; it is not quietly scored as No. If any row is invalid, correct it before the calculator produces an aggregate. Blank lines are ignored, and the input is limited to 1,000 forecast rows and 50,000 characters.
Open the per-row audit to see each squared error. The calculation stays in the browser tab; the tool does not upload or retain the CSV. Keep your dated research journal separately. The calculator receives probabilities and outcome labels, so it cannot verify that you entered them before the result was known or that an outcome was labeled correctly.
Compare the same events at the same horizon
Before comparing a market, model or forecaster, define the evaluation set. Keep the exact question, event identifier, resolution rule and information cutoff. Choose an observation policy in advance, such as one forecast per event at a fixed horizon before its scheduled close. A near-resolution forecast and a forecast made weeks earlier had different information available.
Keep all eligible forecasts in the journal, including difficult cases. If two forecasters cover different events, either restrict the comparison to their shared, explicitly reported set or explain the missing coverage. Do not substitute 50% for a forecast that was never made. Cherry-picking successful examples after resolution can produce an attractive score without demonstrating a useful forecasting process.
Repeated observations need a weighting policy. One hundred snapshots of a single event are not one hundred independent events. Equal weighting of every row gives an event with many snapshots more influence. Correlated contracts can also share much of their information. Our calculator deliberately computes the equal-weight row mean; it does not deduplicate contracts, align horizons, estimate independence or repair selection bias.
For a market-price study, record which price you used: last trade, bid, ask, midpoint or another defined estimate. Save its observation time. Public API snapshots can help preserve what you saw, while the order-book guide explains why those prices are not interchangeable execution promises.
Treat 50% as a transparent reference
The calculator compares the entered probabilities with a constant 50% forecast on the same resolved rows. That reference always scores 0.25 under this binary convention. “Score minus reference” is negative when your entered score is lower and positive when it is higher.
This is an arithmetic reference, not a universal standard of skill. In a domain where Yes is usually rare, always forecasting 50% may be a weak comparator. A historical base rate or a market forecast can be more relevant if it was available before the outcomes and evaluated on the same events and horizon. Do not fit a favorable baseline to the test outcomes and present it as an earlier forecast.
There is no universal “good Brier score” that turns an arbitrary collection into evidence of superiority. The event mix, information horizon, coverage and chosen reference all matter. A small score on almost-certain events cannot simply be ranked against a larger score on difficult balanced questions.
Calibration is a different diagnostic
Calibration asks whether groups assigned a probability tend to occur at roughly that frequency. For a sufficiently informative collection of comparable 80% forecasts, you would examine whether Yes occurred around 80% of the time. One 80% forecast resolving No does not answer that question.
Our chart groups resolved rows into five fixed probability bands. Each point uses the mean forecast probability on the horizontal axis and the observed Yes frequency on the vertical axis. The accompanying table shows the count in every band. Empty bands have no point, and the last band includes 100%.
These are descriptive observations, not a calibration certificate. Sparse bins can move sharply after one outcome; changing the bands changes the display; correlated events reduce what repeated observations can establish. The chart has no confidence intervals and does not fit a recalibration model.
The scikit-learn calibration guide explains why overall Brier loss reflects reliability, resolution and outcome uncertainty together. A lower score therefore does not, by itself, prove better calibration. Check the full pattern and the construction of the evaluation set instead of treating one scalar as every answer.
Keep forecast quality separate from trading PnL
A Brier calculation uses probabilities and outcomes. It does not include entry prices, fees, spreads, available size, capital, transfers or execution timing. A trader's dollars earned cannot be read from its score.
In a simplified fictional $1-settlement contract, a Yes forecast of 0.6 and an entry price of $0.70 imply 0.6 × $1 - $0.70 = -$0.10 expected profit before fees if that 0.6 probability is the appropriate assessment. A positive expected-profit assessment could instead arise at a sufficiently lower price. The probability, price and costs play different roles; an assessed expectation is still not a guaranteed realized result.
Use the payout calculator for contract arithmetic and the trader PnL checklist for account performance. For the meaning of a market-implied percentage, start with probability versus certainty. Combining these views gives you a more useful research process than ranking people by one winning prediction or one headline profit.